You are here:

- Services
- Legionella
- Risk assessment
Legionella portal user manual
Up to: < Risk assessment
Legionella Portal User Manual
Your guide to effective portal use.

Introduction
A suitable and sufficient risk assessment must be carried out to identify and assess the risk of exposure to Legionella bacteria. The risks associated with work activities and water systems at your premises must be considered. Any precautionary measures needed will be outlined.
Factors that increase the risk of developing legionellosis, include, but are not limited to:
- The presence of Legionella bacteria.
- Conditions suitable for growth of the organism. For example, water temperatures between 20°C and 45°C.
- Presence of sludge, scale, rust, algae, other organic matter and biofilms which can be a source of nutrient for the organism.
- Showers and spa pools can create and spread breathable droplets.
- Vulnerable people who may be exposed, such as the young, elderly and immunocomprised.
Temperature control is the traditional strategy for reducing the risk of Legionella in water systems. With these points in mind, it is important that the temperatures of outlets, such as showers and taps are monitored. This monitoring and recording activity should be completed monthly for sentinels (nearest and furthest outlet). Whereas, a representative section of all other outlets should be monitored annually. It is advisable for little used outlets to be flushed weekly. This prevents the build up of nutrient sources that enable the organism to thrive.
Your portal log book will keep an accurate record of monitoring and flushing activities that you complete.
Portal
To access the portal please follow this link. Enter your email address and your unique password. This will direct you to the portal homepage.
Homepage
The homepage will detail the compliance for all of your sites. To view compliance for individual sites, the site will need to be selected from the menu to the top right hand side of your screen.

The homepage will show a breakdown of the following:
- Legionella compliance
- Risk levels
- Low use outlets
- Outlets that are out of specification

- Total compliance - this shows if a risk assessment has been completed. It also highlights if your assessment is in date. For the above example, the site is 100% compliant.
- Risk levels - this details the risks highlighted by your assessment. Once each risk has been actioned and completed this graph updates. Click on a ‘bar’ to open a ‘pop up’ which will detail the risks.
- Low use outlets - this details the percentage of low used outlets that need to be flushed.
- Outlets out of specification - this details whether outlets that are within or out of specification. It also highlights outlets that fall into the ‘other’ category. Click on a segment of the pie chart for further information. A ‘pop up’ will appear that details the corresponding outlets and their temperatures. The other section will hold information for outlets that are flushed but not temperature monitored.
Access Legionella risk assessment and log book
Click on the legionella tab, this will list the sites relevant to your company. From here you can view your Legionella risk assessment report and the summary page.
From the Legionella risk assessment survey summary page, you can view the survey details, the risks and enter your electronic log book.
Select the electronic log book. This is where you can:
- Click on the ‘Site Log Book Summary’ this details when the next risk assessment is due and the latest building schematic.
- Click on ‘View Tasks’ to access a list of tasks. These are broken down into one off, weekly, monthly, quarterly and annual schedules. Select a schedule to drill down into specific tasks. This is where you can add detail and sign off tasks. Tasks that occur regularly will automatically be included on the list so each task can be actioned again.
- Click on ‘check your standard operating criteria’ to view your specific criteria for temperature monitoring. For example mains water temperature should be below 20°C.
- Click on ‘outlet temperature monitoring’ to view graphs.
Overview graphs
Overview graphs show all the outlets identified in your risk assessment and detail tolerance levels.
 Specific outlets
Shows a table detailing the history of each outlet. It includes information like the temperatures, when they were recorded and who by. You can also add the temperature and flushing data here (see below). Graphical representation of the temperatures per outlet are also available.

Outlet monitoring schedule
The portal will automatically schedule in the next date for your temperature monitoring. If you’d rather, this can be done manually. The tick box at the bottom needs to be ticked. This will ensure that email notifications are received and will remind you to take temperatures. The results can be inputted here via the outlet temperature file. To do this you need to complete and upload an excel file.

Asset temperature monitoring - to record the asset temperature an excel spreadsheet will need to be uploaded.

A graphical representation of your data can also be viewed under the specific asset.
Flushing records
Similar to outlet temperature monitoring, there are two sections.
Overview table - this details when the outlets were last flushed and by who.
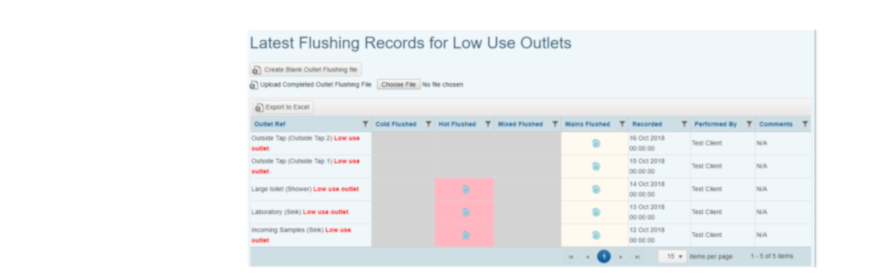
Specific outlets - this details the history for each outlet. From here you can enter the flushing data.

Temperature and flushing records
Temperature records
These can be inputted in two ways:
- Temperature monitoring schedule - an excel spreadsheet can be downloaded. This system will automatically pick the outlets to be tested. You will need to complete the spreadsheet and then select ‘Upload’ within the temperature monitoring schedule. All of your data will be added to each outlet.
- Individual outlets - within each outlet you can select ‘add outlet temperature monitoring’. This opens a pop-up where the temperatures can be inputted (see below).

Flushing records
Records of flushing activities can be added via two methods. Either through the ‘Outlet Temperature Monitoring’ or ‘Flushing Records’.
- Outlet temperature monitoring - only record the data through this channel if there is a temperature to input as well.

- Flushing records - upload an excel spreadsheet via this section of the portal. On the overview tab select ‘create blank outlet flushing file’. This will generate an excel spreadsheet (see below).
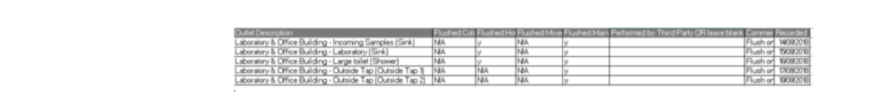
Populate with ‘Y’ or ‘N’ in the flushing column and the date in the recorded column. This can then be saved and uploaded to the overview section.
Adding water sampling reports
Scientific Services’ team will email water sampling reports to you and upload them to your portal. You can view the reports via the ‘Site’ tab on the homepage. A list of sites will appear, select ‘view site documents’. This will display a list of documents/reports which you can view.

If you have any other additional, site specific documents that you wish to add to the portal, do it from this interface.